How Severe Should a Liquidity Stress Test Be?
Executive Summary
Liquidity stress testing remains a cornerstone of effective risk management and regulatory compliance for banks. However, a persistent challenge lies in interpreting what constitutes a “severe but plausible” stress scenario, particularly in the context of evolving depositor behaviours and increasing digitalisation of banking.
This paper aims to address this challenge by examining how stress scenarios can be robustly calibrated using empirical evidence backed by statistical methods, with particular focus on liquidity stress testing informing the Internal Liquidity Adequacy Assessment Process (ILAAP).
Building on recent regulatory guidance, including the Financial Stability Board’s (FSB) 2024 report on depositor behaviour, we investigate how recent bank runs differ from historical events, and what implications this holds for liquidity stress testing.
Key Objectives
To benchmark the severity of liquidity stress scenarios, particularly for small- and medium-sized banks.
To inform scenario design for the ILAAP as well as recovery planning by translating historical data into forward-looking assumptions.
To offer practical guidance for interpreting and applying the “severe but plausible” threshold in a way that is credible and proportionate.
Methodology
Analysis of 66 historical bank runs and stresses, incorporating duration and deposit outflow data.
Application of statistical distribution fitting and use of Monte Carlo simulation to generate percentile-based scenario benchmarks.
Supplementing the model with an approach to reflect more acute deposit runs observed during the 2023 US banking turmoil.
Key Findings
Recent events are faster and more severe: the 2023 failures showed larger deposit outflows over shorter periods compared to historical precedents.
Stress severity varies by driver: idiosyncratic shocks may produce more extreme outcomes than market-wide stresses or even combined stresses, particularly over short horizons.
Illustrative benchmarks (based on simulations and potential shifts):
1-in-10 scenario: ~37% outflows over 37 business days.
1-in-100 scenario: ~58% outflows over 69-business days (approx. 3-calendar months).
Recommendations
Benchmark assumptions against the statistical ranges provided.
Explore scenarios of differing lengths and intensities.
Account for digital banking and social media impacts in scenario design and calibration.
Reconsider whether combined stresses are always the most severe.
Implications for Practice
The insights in this paper can support the development of more grounded, transparent, and dynamic liquidity stress testing, ensuring that banks not only meet regulatory expectations but are better prepared to manage real-world liquidity shocks.
The approaches described can also be readily embedded within Katalysys’ k-alm® solution, enhancing automated stress testing and internal calibration processes.
1. Introduction
Liquidity stress testing is central to bank risk management, yet designing credible scenarios is challenging.
A recurring hurdle in this important process is interpreting the regulatory term “severe but plausible” – a phrase likely to be found in many Internal Liquidity Adequacy Assessment Process (ILAAP) documents – defining what this means in practice, and translating it into clear assumptions such as deposit outflow rates.
How can a bank gain comfort that its stresses are robust enough to adequately test its liquidity resources – and, of course, satisfy board and regulatory scrutiny – without being an implausible academic exercise that either fails to adequately reflect risks, assess liquidity resources, and test management actions, or simply “breaks the bank” and provides little meaningful insight for risk management?
Stresses may also have to fit into a structured interlinked hierarchy to meet differing objectives, such as for the ILAAP, within the Recovery Plan, and even for solvent exit analysis. In this context, being able to clearly outline stages of differing severity becomes important.
In October 2024, the Financial Stability Board (FSB) published a report ‘Depositor Behaviour and Interest Rate and Liquidity Risks in the Financial System,’ in which it provided a comprehensive examination of the dynamics of historical bank runs, including insights from the more recent 2023 US banking turmoil.
The FSB’s report showed how the speed and scale of modern deposit runs may be changing, and how increased digitalisation, mobile banking, and more concentrated depositor bases can influence stresses. In other words, severe but plausible is not a fixed destination, and the goalposts may be shifting.
Building on the FSB's (2024) data and findings, we examined similar historical cases of deposit outflows and stress durations from a slightly different perspective. We combined the data and insights from the FSB’s analysis with some additional datapoints and applied statistical modelling techniques to explore their relevance for small- and medium-sized banks – particularly in relation to the ILAAP, and more broadly to liquidity stress testing.
Our aim was to assess how these data could be interpreted to support the development of stress assumptions and to benchmark the severity of liquidity stress scenarios.
2. Statistical Analysis
Preamble
We analysed 66 historical cases of bank liquidity crises, leveraging certain data collated and published by the FSB (2024), each with a duration (measured in business days), and an outflow of deposits (expressed as a percentage of the pre-crisis total). [1]
We did not seek to substantially expand the core dataset, and it should be acknowledged up front that there are some limitations in the information analysed – primarily, that the available data reflect only a proportion of liquidity stresses, particularly weighted towards bank runs that ended in failure, or were for some reason well-publicised.
Inevitably, therefore, many additional stresses – especially those resolved behind closed doors – are not captured. The dataset is built on publicly available information and thus may contain errors or inconsistencies; nonetheless, we consider it sufficiently robust for the intended purpose.
[1] In this context, deposits exclude non-deposit wholesale funding such as interbank and money market instruments (commercial paper, repo., etc.)
Historical Analysis of Deposit Runs
The data showed that most deposit runs, both historical (blue dots) and more recent (orange dots), last up to 30-business days. However, the recent runs (during 2023) tended to show a higher proportion of deposit outflows arising over a shorter period compared to those occurring historically, which was already highlighted by the FSB in its 2024 report.
Unsurprisingly, there was no strong correlation to be found between stress duration and the level of outflows experienced.
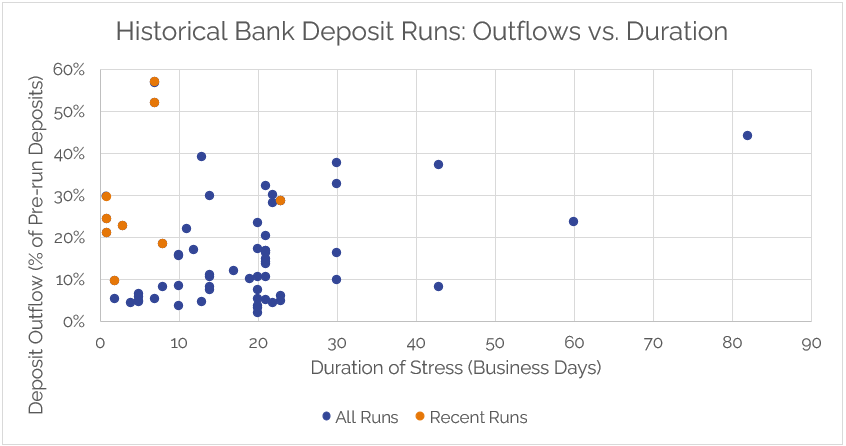
Sources: FSB (2024), BCBS (2023), FDIC (2023), OIG (2009), Katalysys calculations
We also evaluated the drivers of liquidity stresses, drawing on our own research.
This alternative perspective on the triggers of liquidity crises was aimed at supporting the need to develop differing types of scenarios, each with a specific set of assumptions – under UK prudential rules, banks must model liquidity in each of idiosyncratic, market-wide, and combined stresses.

Sources: FSB (2024), BCBS (2023), FDIC (2023), OIG (2009), Katalysys calculations
The splits show that market-wide events – triggered by systemic shocks, which may stem from adverse macroeconomic stresses that may take longer to fully emerge – are typically longer-lived yet shallower, albeit there were outliers in all cases.
This aligns with the position oftentimes taken by banks in their stress testing development processes: i.e., in a market-wide event, depositors may be less inclined to withdraw funds when compared to a firm-specific stress, recognising that no institution is completely immune and, consequently, there may be limited benefit in transferring deposits from one bank to another. Deposit guarantee schemes such as the Financial Services Compensation Scheme (FSCS) are also typically more visible during these crises and can provide reassurance to depositors.
Comparatively – caveated by the limitations of sample size – the data suggest that idiosyncratic and combined shocks tend to be both more rapid and involve larger outflows of deposits: the median stressed outflows and durations were similar for idiosyncratic and combined stresses, but pure idiosyncratic stresses had some extreme runs evidenced by the mean outflow rate skewed significantly higher than that at the 50th percentile.
This provides an interesting consideration: that specific idiosyncratic shocks may exhibit increased levels of stress compared even to combined stress events (in which some adverse firm-specific factor arises alongside a broader shock).
While this may align with the views already held by some firms, it could appear counterintuitive to others whose stress testing frameworks typically place the combined scenario as the most severe by design.

Sources: FSB (2024), BCBS (2023), FDIC (2023), OIG (2009), Katalysys calculations
Statistical Modelling & Scenario Simulation
To extrapolate from historical data, we applied statistical distributions to model outflow severity and duration. Our statistical analysis serves to turn a series of historical observations into a more comprehensive, forward-looking framework. To achieve this, we adopted certain methodologies, which are summarised as follows:
Distribution fitting is a process of selecting a statistical distribution that best represents a given dataset. We fitted stressed outflows and bank run durations to distributions to generate smooth, continuous models.
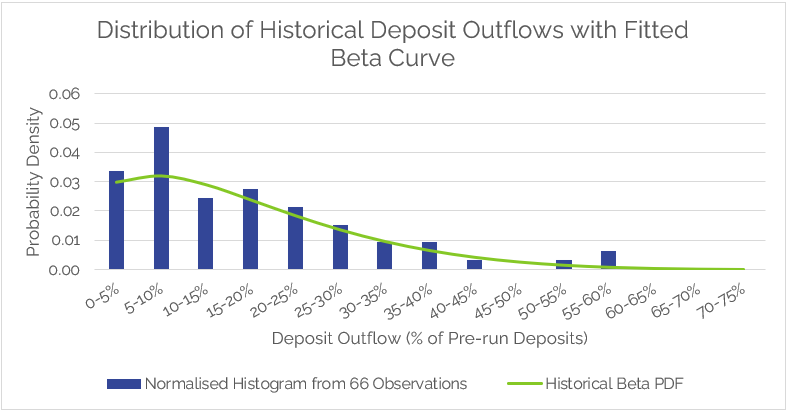
A beta distribution was used to model deposit outflows (which must range from 0% to 100%) with two shape parameters, capturing skewed and bounded data.
A gamma distribution was used to model stress durations (which must be greater than 0-days) with shape/scale parameters, fitting potentially protracted stresses.
Monte Carlo simulation uses random sampling to model the probability of different uncertain outcomes. We used simulations to draw 20,000 trials from each fitted distribution, providing a source for relevant percentiles for use in calibrating the severity of stress scenarios. [2]
Firstly, we fitted the stressed outflows to a beta distribution. The beta distribution, which gave a good fit, was selected to model the bounded nature of deposit outflows (the possible range of outflows must fall somewhere between 0% and 100%) and to account for skewness, since most runs exhibited high levels of withdrawals, with a few very extreme outliers. [3]
Sources: FSB (2024), BCBS (2023), FDIC (2023), OIG (2009), Katalysys calculations
Turning to length of runs, we adopted a gamma distribution, which can be suitable for modelling non-negative, continuous variables such as time. The gamma model does not perfectly describe the data, but the deviation is not significant, and we consider it to be acceptable for our practical purposes; when fitted, the distribution showed a long right tail, reflecting the possibility of very protracted stresses.

Sources: FSB (2024), BCBS (2023), FDIC (2023), OIG (2009), Katalysys calculations
With the fitted parameters, we ran 20,000 Monte Carlo simulations – sampling duration and outflows independently, given the immaterial correlation observed – to generate worst-case scenarios and inputs for liquidity stress models. We performed 200 replications for stable, robust outputs, and for empirical error estimates.
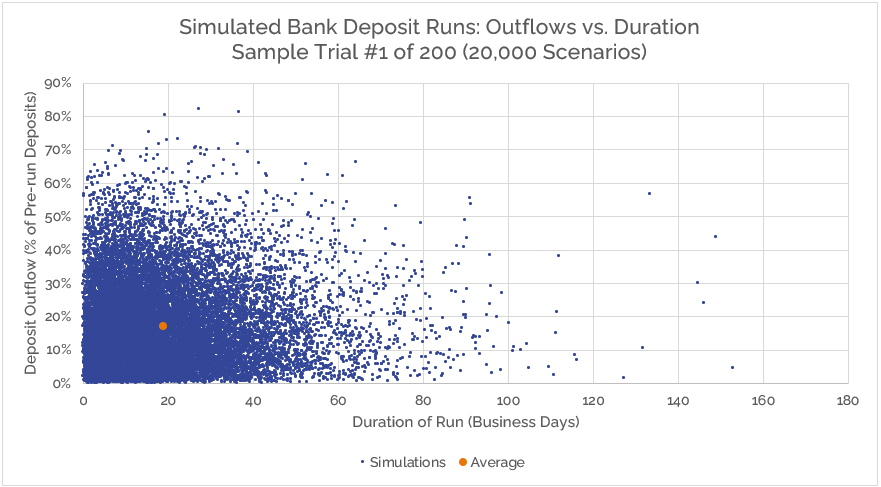
Source: Katalysys calculations
Based on the simulated distributions of outflows and stress duration, we derived the following benchmarks for banks to consider when defining their own stress scenarios. These values, given as ranges to incorporate statistical uncertainty, reflect a range of illustrative worst-case scenarios that may be useful for defining the severity of liquidity stresses and comparing scenarios.

Source: Katalysys calculations
The scenario at the 99th centile is associated with theoretical outflows of 54% to 55%, which closely approximates those experienced by First Republic Bank (57%) and Silvergate (52%) (both as part of the 2023 US banking turmoil), providing a guide on the extreme nature of those stresses.
For the same scenario, stress duration was 69- to 71-business days, which is equivalent to around 95-calendar days, or 3-months – a familiar milestone commonly aligned with internal liquidity risk appetites as well as matching the granular breakdown in the liquidity-focussed PRA110 return (92-days).
[2] The analytic approximation of Monte Carlo sampling error scales as 1/√ n; with 20,000 trials, the Standard Error of the 95th percentile for outflows is ± 0.15 pp.
[3] While the lognormal distribution yielded a marginally better statistical fit, it lacks the bounded flexibility needed for this application. In contrast, the beta distribution is inherently bounded between 0% and 100%, making it well-suited to model deposit outflows. Accordingly, we selected the beta distribution for both analytical and simulation purposes.
[4] The sampling errors for duration for each centile were ±0.3 days, ±0.5 days, and ±1.0 days respectively, these were rounded as necessary for practical application.
3. Further Considerations and Limitations
When looking to apply these benchmarks, banks must also consider structural factors such as the composition and contractual maturity of their deposit base. For example, retail demand deposits behave differently under stress than term deposits or wholesale funds. Deposit guarantee schemes, such as the FSCS in the UK, also play a crucial role in moderating depositor panic.
Data from past events, including Northern Rock, Credit Suisse, and Icesave (Landsbanki), show considerable variation in stress outcomes based on deposit type; therefore, incorporating these nuances into scenario design is essential.
Overall, real-world outcomes depend on a range of variables including deposit structure, market confidence, central bank support, and media coverage, to name a few, and no model can fully capture all these dynamics.
Below we explore some notable areas that warrant further consideration in the context of liquidity stress testing.
Funding Structure
While the benchmarks arising from these simulations may offer a useful reference point for scenario calibration (and beyond the limitations already outlined), it is also important to acknowledge that each bank’s unique funding structure has a critical role for the stress testing exercise and its outcomes.
Many banks raise fixed-term deposits that mature several months or even years into the future – or take notice deposits with lengthy withdrawal periods – which cannot be readily withdrawn by customers and would not therefore be subject to the same behavioural outflow risk as short-term or demand deposit products. The level of deposits covered by a deposit guarantee schemes such as the FSCS can also vary significantly from bank to bank, and was found by the FSB to play an important role in the outflow of deposits under stress. [5]
The various types of deposits raised by banks must also play a factor, given the accepted differences in sensitivity to liquidity stress that are enshrined in regulation: firms with proportionally higher levels of wholesale deposits may not experience the same level of outflows as peers with more diversified pools of retail deposits, for example. Non-deposit wholesale funding instruments will also play a role for some firms but are not considered under this deposits-based analysis.
These structural characteristics can be expected to have a material effect on the impacts of a liquidity stress, but such nuances are difficult to fully capture, as this type of granular data on contractual maturities, liability compositions, or withdrawal constraints, etc. may not be easily available within historical datasets.
Thus, while the statistical outputs above provide a reasonable starting point, results should be interpreted as industry-level benchmarks, and individual firms must adapt and scale stresses to their own liability structures and tenor profiles.
By way of a limited indication, the following data on outflows by deposit type may provide some helpful insights:

Source: HM Treasury (2009), Zeissler et al (2019), SNB (2024)
A simple option to attempt to mitigate some of the obstacles would involve benchmarking the stressed level of outflows against deposits available for withdrawal within the stress period instead of using total pre-run deposits as the denominator – a simple workaround that might negate this limitation.
Banks might also look to the variances in outflow rates by deposit type, summarised above, as a guide for differentiating between stress assumptions.
[5] See Graph 12, chart 2, of the FSB’s 2024 report, which shows insured/uninsured data for US banks.
Deposit Composition
The benchmarks provide a stressed outflow rate that can be applied to the deposit mix at the reference date, but don’t allow for how the residual deposit base, or any new deposits raised in response to a stress (i.e., management actions), might shift in composition.
Bank of England data show that, during the Covid‑19 crisis and associated lockdowns, households moved noticeably from term and notice (time) accounts into demand (sight) deposits. That suggests two important considerations:
The make‑up of remaining deposits after a stress event may differ from the pre‑stress mix. In response, banks might target specific products when offering higher rates to stabilise outflows or attract new funding.
A larger proportion of demand deposits can potentially increase run‑off risk and offer lower levels (comparatively) of stable funding. As a result, banks may need to adjust their liquidity buffers and funding strategy on a longer-term basis once the immediate stress has been navigated.
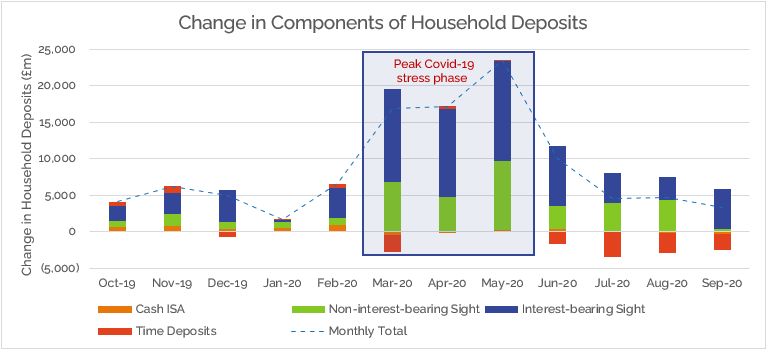
Source: Bank of England, Sectoral deposits and Divisia money data
Peak Outflows
The FSB additionally published certain data on peak outflows within individual stress events, which can again be useful when designing general stress scenarios and assumptions, as well as providing useful insights for intraday risk management.
These values (select items shown below) confirm the largest deposits withdrawals experienced by affected banks within one single day of the broader stress period. Owing to the limited number of data points, further statistical analysis has not been explored.

Source: FSB (2024)
Adjusting for Emerging Dynamics
It is appropriate to recognise the potential emerging changes in the way in which deposit runs may play out: as noted by the FSB, recent events such as the 2023 US banking turmoil have highlighted several factors that could influence the speed and scale of modern stresses.
The increased prevalence of digital banking platforms and mobile banking applications, and the rise of social media as a means for spreading news, suggests that future runs could be both faster and larger than historical precedents with the potential for a higher magnitude of outflows in the initial acute phase of the stress.
Depositors can easily and instantly make withdrawals from their phones, and they may be influenced by real-time news or social media posts that can spread rapidly, amplifying panic, and triggering ever faster and larger withdrawals.
This shift could make forecasting future severe but plausible scenarios even more challenging. That situation has not escaped the attention of regulators, and bank Treasury departments and boards will also be cautiously evaluating this threat.
Our original beta (for outflows) and gamma (for stress duration) fits described above were calibrated to 66 historical bank runs. However, 9 recent events from the 2023 US banking turmoil showed markedly more severe outflows over shorter periods.
Re-fitting a parametric model to just 9 points could be statistically unstable; however, we considered it important to reflect these events in our analysis while still retaining the richer historical dataset.
To achieve this, we used a bootstrap-mixture approach. In each Monte Carlo trial, we drew from the 9 recent events with an approx. 14% probability (reflecting their share of the total dataset, i.e., 9 out of 66 observations). The remaining 86% of points were sampled from the fitted historical beta and gamma distributions. This preserves the robustness of the longer-run fits, while explicitly embedding the shorter, sharper stresses observed in 2023.
Using this blended simulation, we re-calculated the percentile benchmarks. The updated figures are presented below alongside the originals for comparison; all units are consistent with previous tables: outflows are expressed as a percentage of pre-run deposits, and stress duration is shown in business days.
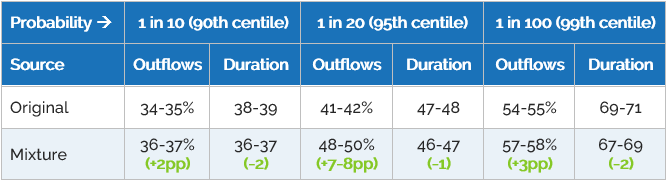
Source: Katalysys calculations
Considering the recent runs typically involved higher outflows over a shorter duration, the benchmark levels for outflows increased, while they reduced for stress duration. This model can be supplemented as future stresses arise and more data become available.
Given the evolving dynamics discussed above, banks should ensure they have considered within their stress testing frameworks how these risks apply within their business to account for the potential for more extreme and more rapid liquidity shocks.
Banks could look to the revised benchmarks from the mixture model reflecting the extra weight allocated to recent events. By re-evaluating the implications of this emerging change, banks may be able to ensure they are better prepared for potential shifts in how stresses pan out.
4. Suggestions for Stress Testing
Building on our findings from this exercise, we propose four recommendations that banks can consider when undertaking their own liquidity stress testing exercises:
Recommendation 1
Suggestion: Compare outflow assumptions against the benchmarks set out in this paper, based on the desired severity level, and record this as part of the stress documentation within the ILAAP (adapted to account for firm-specific factors, such as the term structure of liabilities and composition of deposits, e.g., compare modelled outflows to the total of deposits available for withdrawal within the stress window).
Approach: Leverage stress design sessions to specify the targeted level of severity, considering the required purposes: e.g., ILAAP stresses calibrated to one confidence level, scaled up to a higher percentile for quantitative reverse stress testing or recovery planning. Consider the relevance of varying the level of severity across differing scenarios, e.g., a very severe idiosyncratic stress, and a more moderate market-wide downturn. Clearly capture the rationale for the severity levels selected, and carefully document this in the ILAAP, Recovery Plan, etc.
Recommendation 2
Suggestion: Allow for stresses to evolve along differing paths, e.g., shorter, sharper shocks spanning a narrower time band, compared with drawn-out scenarios that involve lower but sustained outflow levels.
Approach: Explore scenarios of varying duration – consider a short, sharp idiosyncratic shock spanning, say, up to 60- or 90-days, contrasted with, e.g., an adverse market-wide scenario playing out over many months.
Recommendation 3
Suggestion: Evaluate the relevance of digitalisation and other technological advancements within the funding profile that might cause changes in the way stresses pan out.
Approach: Tailor and refine stress assumptions taking account of observations from the 2023 US banking turmoil and assess the need to increase the level of severity considering these recent events. Cautiously consider the amended benchmarks from the mixture model, which add extra weight to the recent bank runs.
Recommendation 4
Suggestion: Re-examine whether the combined stress must always be the most severe and consider that idiosyncratic shocks may exceed it, especially over a short horizon.
Approach: Use stress scenario workshops and planning sessions to re-evaluate the existing liquidity stress hierarchy and consider the relevance of embedding idiosyncratic stresses as a more severe scenario, or the most adverse over a specified timeline: for example, idiosyncratic most severe over a 30-day period, but combined more severe on aggregate, over an entire year.
5. Conclusions
Banks face increasing pressure to ensure their stress testing frameworks are robust, evidence-based, and adaptable. By combining historical data with simulation techniques, this report offers a framework for calibrating liquidity scenarios that are both severe and plausible in today’s environment.
Through refined assumptions and enhanced scenario design, firms can better prepare for evolving liquidity risks. These methods can be integrated directly into Katalysys’ k-alm® platform, enhancing automation and analytical rigour across the stress testing lifecycle.
How We Can Help
At Katalysys, we assist banks in conducting robust, proportionate, and forward-looking ILAAP exercises, with a strong focus on effective stress testing. We support clients in running Board and management workshops, selecting stress scenarios tailored to a bank’s unique risk profile, and we also provide liquidity stress testing as part of our cloud-based k-alm® solution.
Our expertise ensures that the stress testing framework is both fit-for-purpose and aligned with industry best practices. We focus on demystifying the process, delivering insights that add value, but are also practical and actionable.
For more information, please contact:

Josh Nowak
Managing Director, Risk & Regulatory Consulting
T: +44 (0)7587 720 988

Ravi Patel
Vice President, Risk & Regulatory Consulting
T: +44 (0)7387 972 729
Disclaimer
This publication has been prepared by Katalysys Ltd (Katalysys) for informational purposes only. The analysis, opinions, and scenarios presented herein are based on publicly available data and Katalysys’ interpretation of regulatory expectations and historical events. While reasonable efforts have been made to ensure the accuracy of the information provided, no representation or warranty, express or implied, is made as to the completeness, reliability, or accuracy of the content.
This document does not constitute legal, regulatory, accounting, or investment advice, nor should it be relied upon as a substitute for specific professional advice tailored to individual circumstances. Any models, simulations, or benchmarks included are illustrative and should not be used as the sole basis for risk management or regulatory submissions. Readers are encouraged to undertake their own analysis and seek appropriate professional guidance before making any decisions or implementing any recommendations based on the material herein.
Katalysys accepts no liability for any loss or damage arising from reliance on the information contained in this publication. All views expressed are those of the authors as of the date of publication and are subject to change without notice.
Sources and References
Basel Committee on Banking Supervision (2024) ‘The 2023 banking turmoil and liquidity risk: a progress report’ (retrieved from https://www.bis.org/bcbs/publ/d582.htm)
Federal Deposit and Insurance Corporation (2023) ‘FDIC’s Supervision of First Republic Bank’ (retrieved from https://www.fdic.gov/news/press-releases/2023/pr23073a.pdf)
Financial Stability Board (2024) ‘Depositor Behaviour and Interest Rate and Liquidity Risks in the Financial System: Lessons from the March 2023 Banking Turmoil’ (retrieved from https://www.fsb.org/2024/10/depositor-behaviour-and-interest-rate-and-liquidity-risks-in-the-financial-system-lessons-from-the-march-2023-banking-turmoil/)
HM Treasury (2009) ‘The Nationalisation of Northern Rock’ (retrieved from https://webarchive.nationalarchives.gov.uk/ukgwa/20170207052351/https:/www.nao.org.uk/wp-content/uploads/2009/03/0809298.pdf)
Office of Inspector General (OIG), Department of the Treasury (2009) ‘Safety and Soundness: Material Loss Review of PFF Bank and Trust’ OIG-09-038 (retrieved from https://oig.treasury.gov/system/files/Documents/oig09038.pdf)
Swiss National Bank (2024) ‘Financial Stability Report’ (retrieved from https://www.snb.ch/public/publication/en/www-snb-ch/publications/financial-stability-report/2024/stabrep_2024/0_en/stabrep_2024.en.pdf)
Zeissler, et al (2019) ‘Ireland and Iceland in Crisis C: Iceland’s Landsbanki Icesave’ Journal of Financial Crises – Vol. 1 Iss: 3, 27-43 (retrieved from https://elischolar.library.yale.edu/journal-of-financial-crises/vol1/iss3/3)